Answer Question
Plotting symmetrical component phasor diagram using Sequence Component Filter
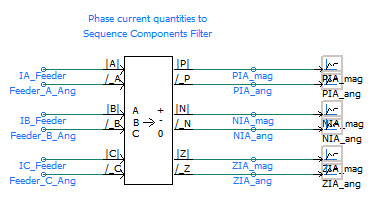
I would like to plot the phasor diagram in the XY Plot and the results so far are disappointing. Below is my Seq Component input which should provide the necessary conversions and the XY Plot I think I am to use. I presume I am doing this wrong and would like some help for the board.
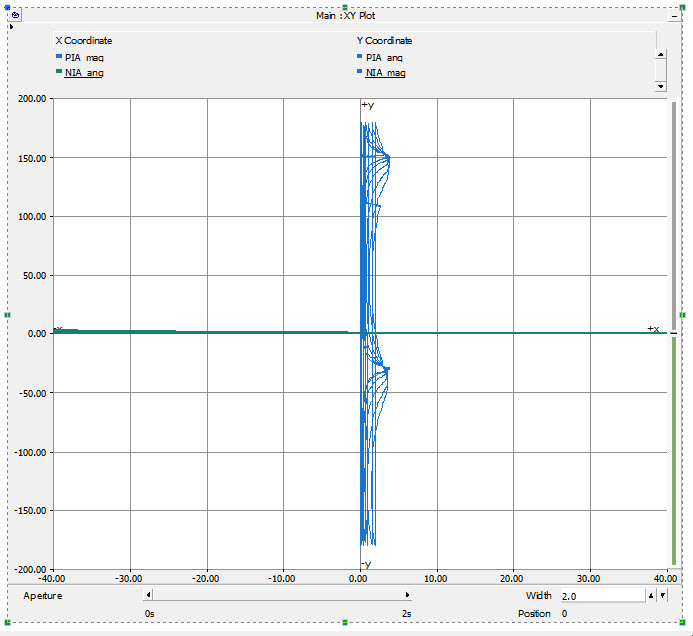
This is showing a partial run with an AB-G fault on the system taken from a multimeter located on the feeder near the fault. I have tried variations and in the image is a test with Pos Seq amplitude in X and the mag in Y and a reversal of this for the negative only to see what would happen.
I am thinking I need to add logic to get the max value maybe and only plot that from the run, but instead of beating my head against the wall, I am asking.
Thanks.