Staff Answer

Jul 15, 2014 - 08:46 AM
1. With Micrsoft Excel
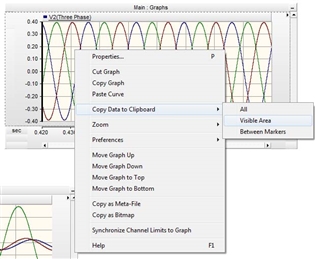
You can export data of a graph in the PSCAD to Micrsoft Excel as below. Righ cliclk on the garph and select “Copy Data to Clipboard”. Then you can see three options.
i.e. All, Visible area and Between Markers. If you select “All”, all the data in the graph (for the complete simulation run) is copied to clipboard. If you select “Visible Area” or “Between Markers”, only the data points in the visible area or between markers is copied to the clipboard.

Then go to the Excel, and Select “Paste Special”. In the “Paste Special” dialog box, you have three options as “Unicode Text”, “Text” and “Csv”. Please select “Csv” and click “OK”. Now you can see that your data is visible as a table with the headings that you gave to your output channels.
First column is the time range.
Now you can do the analysis in Excel.
2. With MATLAB
If you want to use MATLAB instead of Microsoft Excel, then you have to follow the below procedure.
First select the data as same as under 1. Then open the MATLAB editor file and type the variable name for the data. Say Volt. Then paste the data as below and use save command as in the line two. Save the MATLAB file as the same name that you have given under the “Save” command.
Volt = [ “Paste the data here”]
save Voltage_data %Voltage_data is the name of the m file
Now you have a MATLAB m file with all the data that you copied to the clipboard. Again the first column in this variable is the time. You can use these data to do plotting and other analysis same as you are normally doing.
--
George Wai,
Software Support & Development Specialist
Manitoba HVDC Research Centre
a division of Manitoba Hydro International Ltd.
211 Commerce Drive | Winnipeg, Manitoba, Canada R3P 1A3
T +1 204 989 1241 | F+ 1 204 989 1277
support@pscad.com | www.hvdc.ca | www.pscad.com
--


Add New Comment