Staff Answer

Apr 30, 2014 - 01:56 PM
Hello
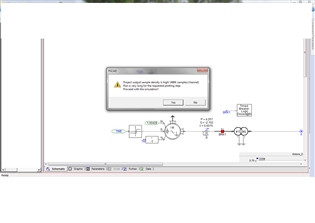
The high density warning message that you are getting is just a warning that there is a lot of data being passed between the simulation and the PSCAD program for plots and storage. The 2 main factors that affect how much data are passed between the simulation and PSCAD are:
- number of output channels in your project
- the plot step.
If you are seeing the warning message, then you probably have many channels or a small plot step or both. Again, this message is just a warning and in some cases it’s because the user is not being practical about how much data the project is requesting.
A common mistake I see is when users plot too many signals.
Duration of Run (sec)
This is the total length of the simulation run, entered in seconds. If you start from time zero, this is the finish time of the run. If you start from a snapshot file (pre-initialized state), this is the length of run from the snapshot time.
Solution Time Step (us)
This is the EMTDC simulation time step, entered in microseconds. The default is 50 ms, which is an optimum step for most practical circuits. However, users should make sure that the time step selected is suitable for their simulation. This input sets the value of the EMTDC internal variable DELT.
Channel Plot Step (us)
This is the time interval at which EMTDC sends data to PSCAD for plotting as well as writing data to output files. It is always an integer multiple of the EMTDC simulation time step. Usually a 250 ms plot step provides a reasonable resolution and speed.
Smaller sampling intervals (higher sampling rate) can decrease the simulation speed considerably due to an excessive transfer of data from EMTDC to PSCAD (without adding much to the plot resolution). Users can experiment with this number for a given project. If the sampling interval is too large, the waveforms may appear 'choppy'. If you are debugging the case, it is a good practice to plot every point in the simulation; that is, plot sampling time as equal to EMTDC simulation time step.
A trap that even the most experienced engineers can readily fall into is the setting of plot step too broad with respect to the level and period of noise in the signal. If a signal is periodic at a frequency similar to the plot step interval, the perceived output may be quite different to the actual signal. As a basic rule: If you are puzzled by the results observed from a plotted simulation output, run the case with the plot step equal to the EMTDC time step and compare the results.
NOTE: The plot step can be modified during a run (or after starting from a snapshot). You can change the value from the Project Settings dialog or from the Runtime bar.
--
George Wai,
Software Support & Development Specialist
Manitoba HVDC Research Centre
a division of Manitoba Hydro International Ltd.
211 Commerce Drive | Winnipeg, Manitoba, Canada R3P 1A3
T +1 204 989 1241 | F+ 1 204 989 1277
support@pscad.com | www.hvdc.ca | www.pscad.com
--


Add New Comment