
Answers


Oct 14, 2020 - 08:18 PM
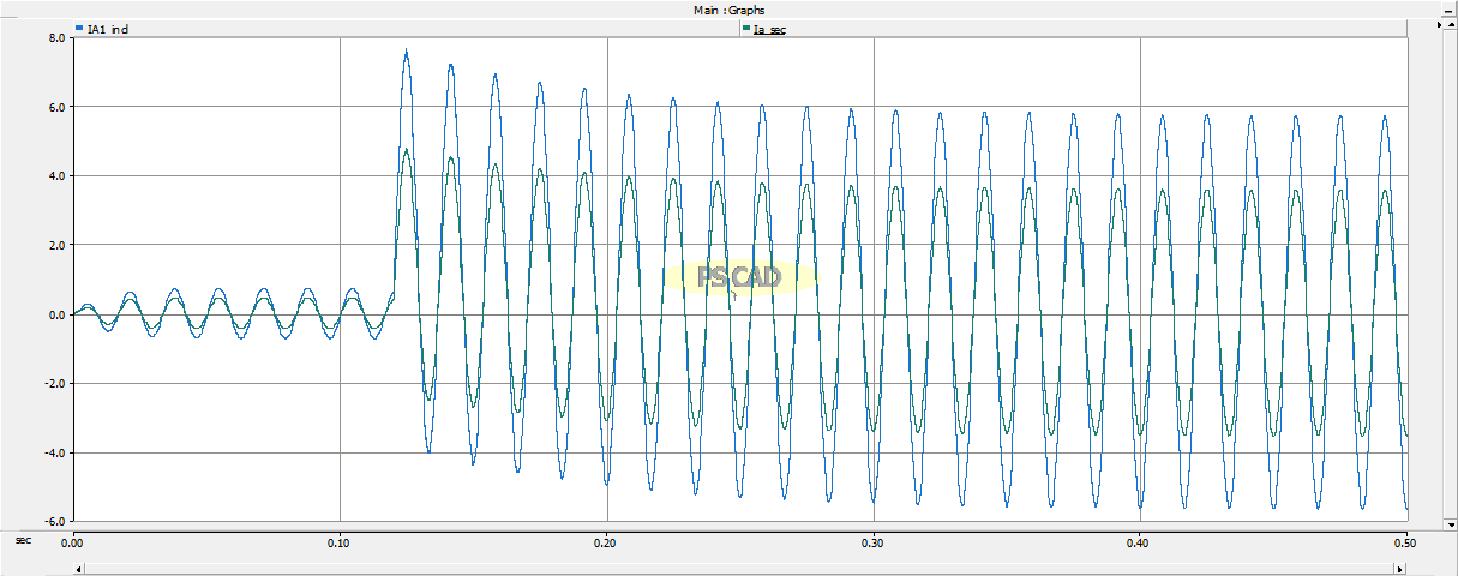
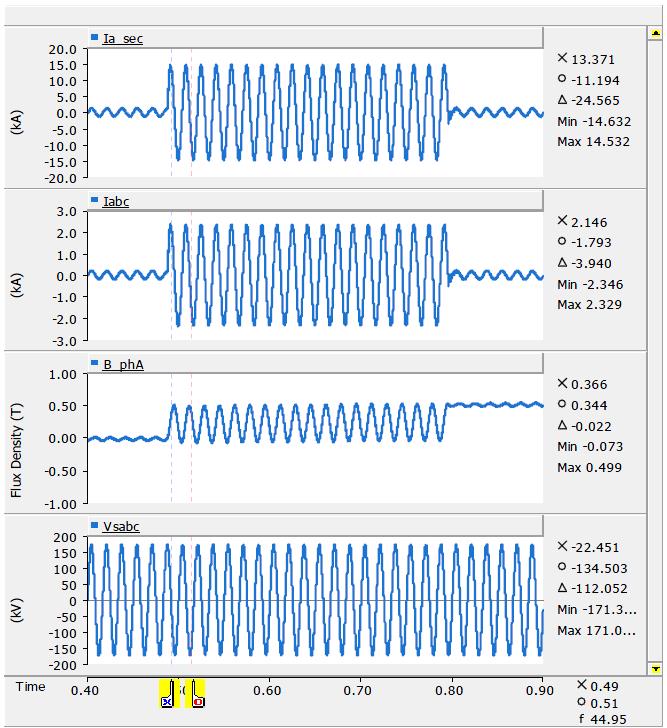
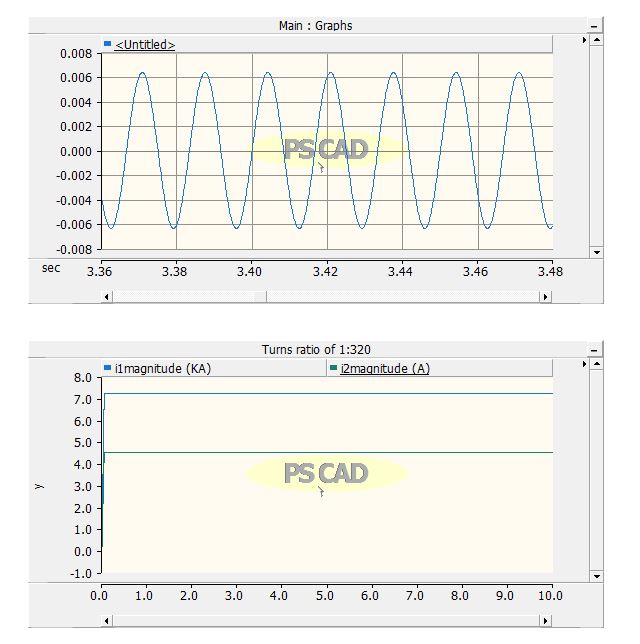
On your plot, I can see on Y-axis the unit is kA. How can kA and A be plotted on the same graph?
It is actually 4.5 kA what I can interpret from the graph.
It is actually 4.5 kA what I can interpret from the graph.

Add New Comment