
Answer

Jul 17, 2018 - 06:53 AM
Hi there.
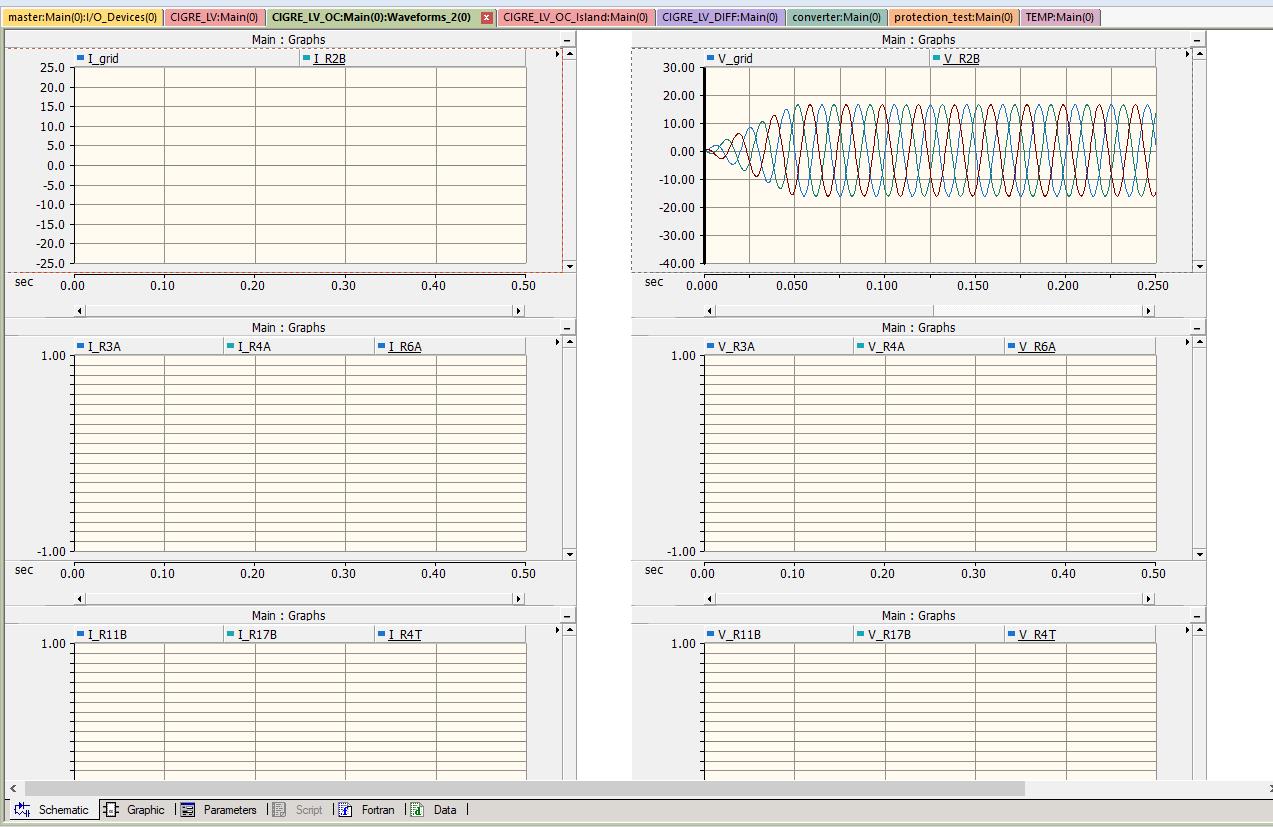
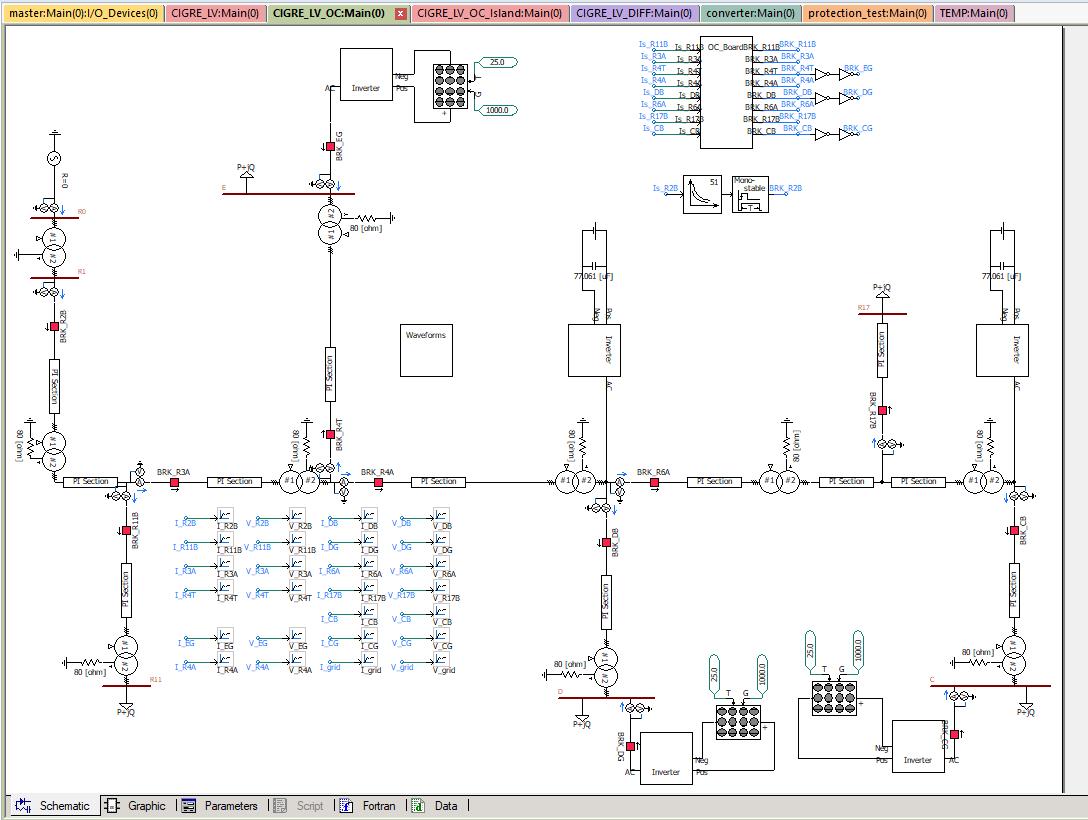
I believe that you have used copy and paste several times in your model. Just drag your scope signals again then you will get your graph.
Regards
Hasan
I believe that you have used copy and paste several times in your model. Just drag your scope signals again then you will get your graph.
Regards
Hasan


Add New Comment