
Answers
Oct 01, 2017 - 11:49 AM
Attached is the output file.


Oct 01, 2017 - 02:28 PM
What are these values? For which field?
1.5578982608877 84.728672623839 15.314612339137 6.6074739324178
1.5578986723152 84.728688087935 1.5578986723144 84.728688088226 15.314611674981 6.6074772641241
1.5578982608877 84.728672623839 15.314612339137 6.6074739324178
1.5578986723152 84.728688087935 1.5578986723144 84.728688088226 15.314611674981 6.6074772641241
Oct 02, 2017 - 08:25 AM
Source: harmonics impedance output
Jul 01, 2020 - 04:48 PM
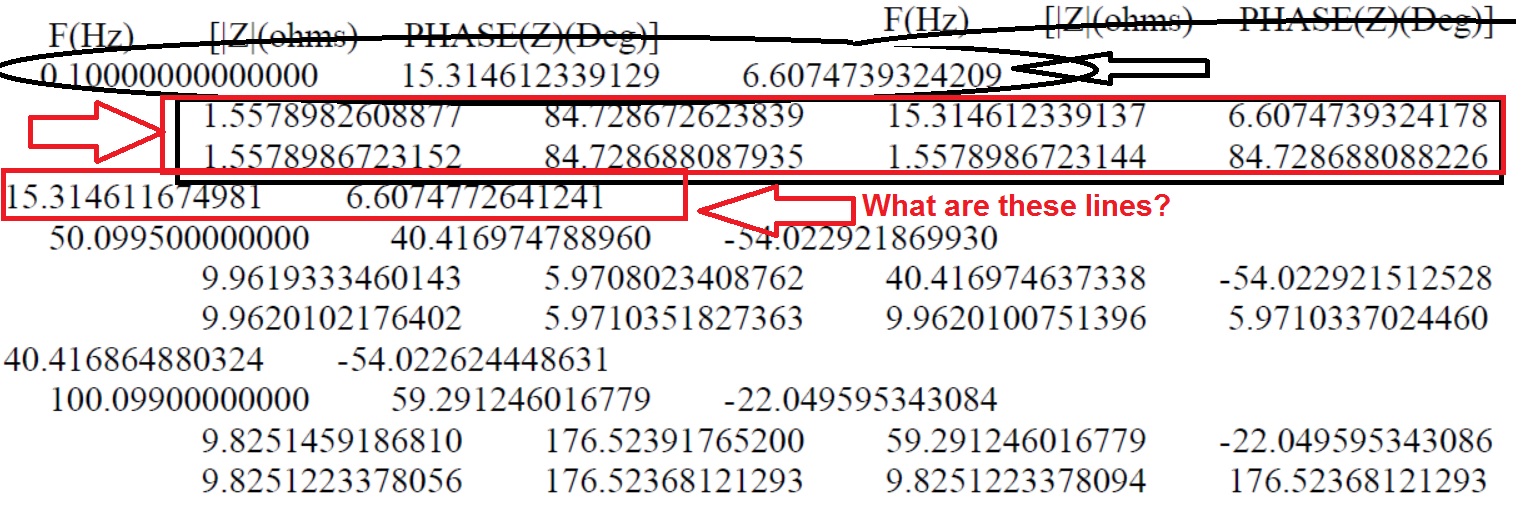
Since you have selected the "Impedance output type" as "Phase impedance" you get the output in three lines for each frequency set.
In the first line: Frequency, Impedance of phase 1, corresponding phase angle
in second-line: Impedance phase 2 to phase 1, corresponding phase angle, Impedance of phase 2, corresponding phase angle
in third-line: Impedance phase 3 to phase 1, corresponding phase angle, Impedance phase 3 to phase 2, corresponding phase angle, Impedance of phase 3, corresponding phase angle
![]()
![]()
In the first line: Frequency, Impedance of phase 1, corresponding phase angle
in second-line: Impedance phase 2 to phase 1, corresponding phase angle, Impedance of phase 2, corresponding phase angle
in third-line: Impedance phase 3 to phase 1, corresponding phase angle, Impedance phase 3 to phase 2, corresponding phase angle, Impedance of phase 3, corresponding phase angle
Nov 10, 2021 - 07:21 PM
You can use MATLAB to plot the graphs.
Parameters need to be set as follows in Harmonic Impedance Component Frequency Increment Type: Linear Scale Impedance output type: Phase Impedance Frequency output unit: Hz Impedance output units: Magnitude and Phase (Deg)
Copy and paste the content of the text document in an M-File.
Parameters need to be set as follows in Harmonic Impedance Component Frequency Increment Type: Linear Scale Impedance output type: Phase Impedance Frequency output unit: Hz Impedance output units: Magnitude and Phase (Deg)
Copy and paste the content of the text document in an M-File.

By
your question is not clear!
By
Can you please check harm.out? how do you plot this in Excel?
Add New Comment