
Answers

Jan 27, 2015 - 11:15 AM
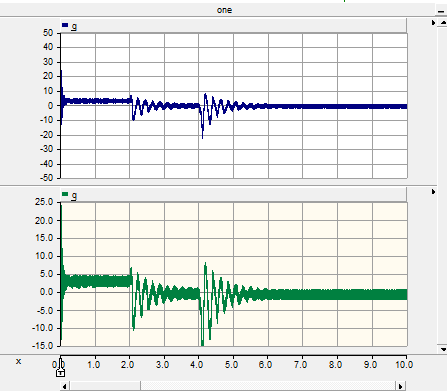
As shown in the first picture, you can get this figure by right click on the figure and choose add overlay.
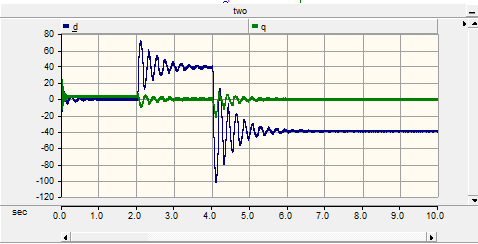
In the second figure, you can get it by press and hold control button and drag the measurement channel into the desire graph.
I hope that I helped you
Good luck
In the second figure, you can get it by press and hold control button and drag the measurement channel into the desire graph.
I hope that I helped you
Good luck


Add New Comment